Do you run load tests in our environment?
When access is granted, we prefer staging mirrors with anonymized data; otherwise we co-design replayable benchmarks.
Bangkok-based programming consulting for teams that need clear evidence before they optimize: sampling profilers, allocation traces, and latency budgets tied to real code paths.
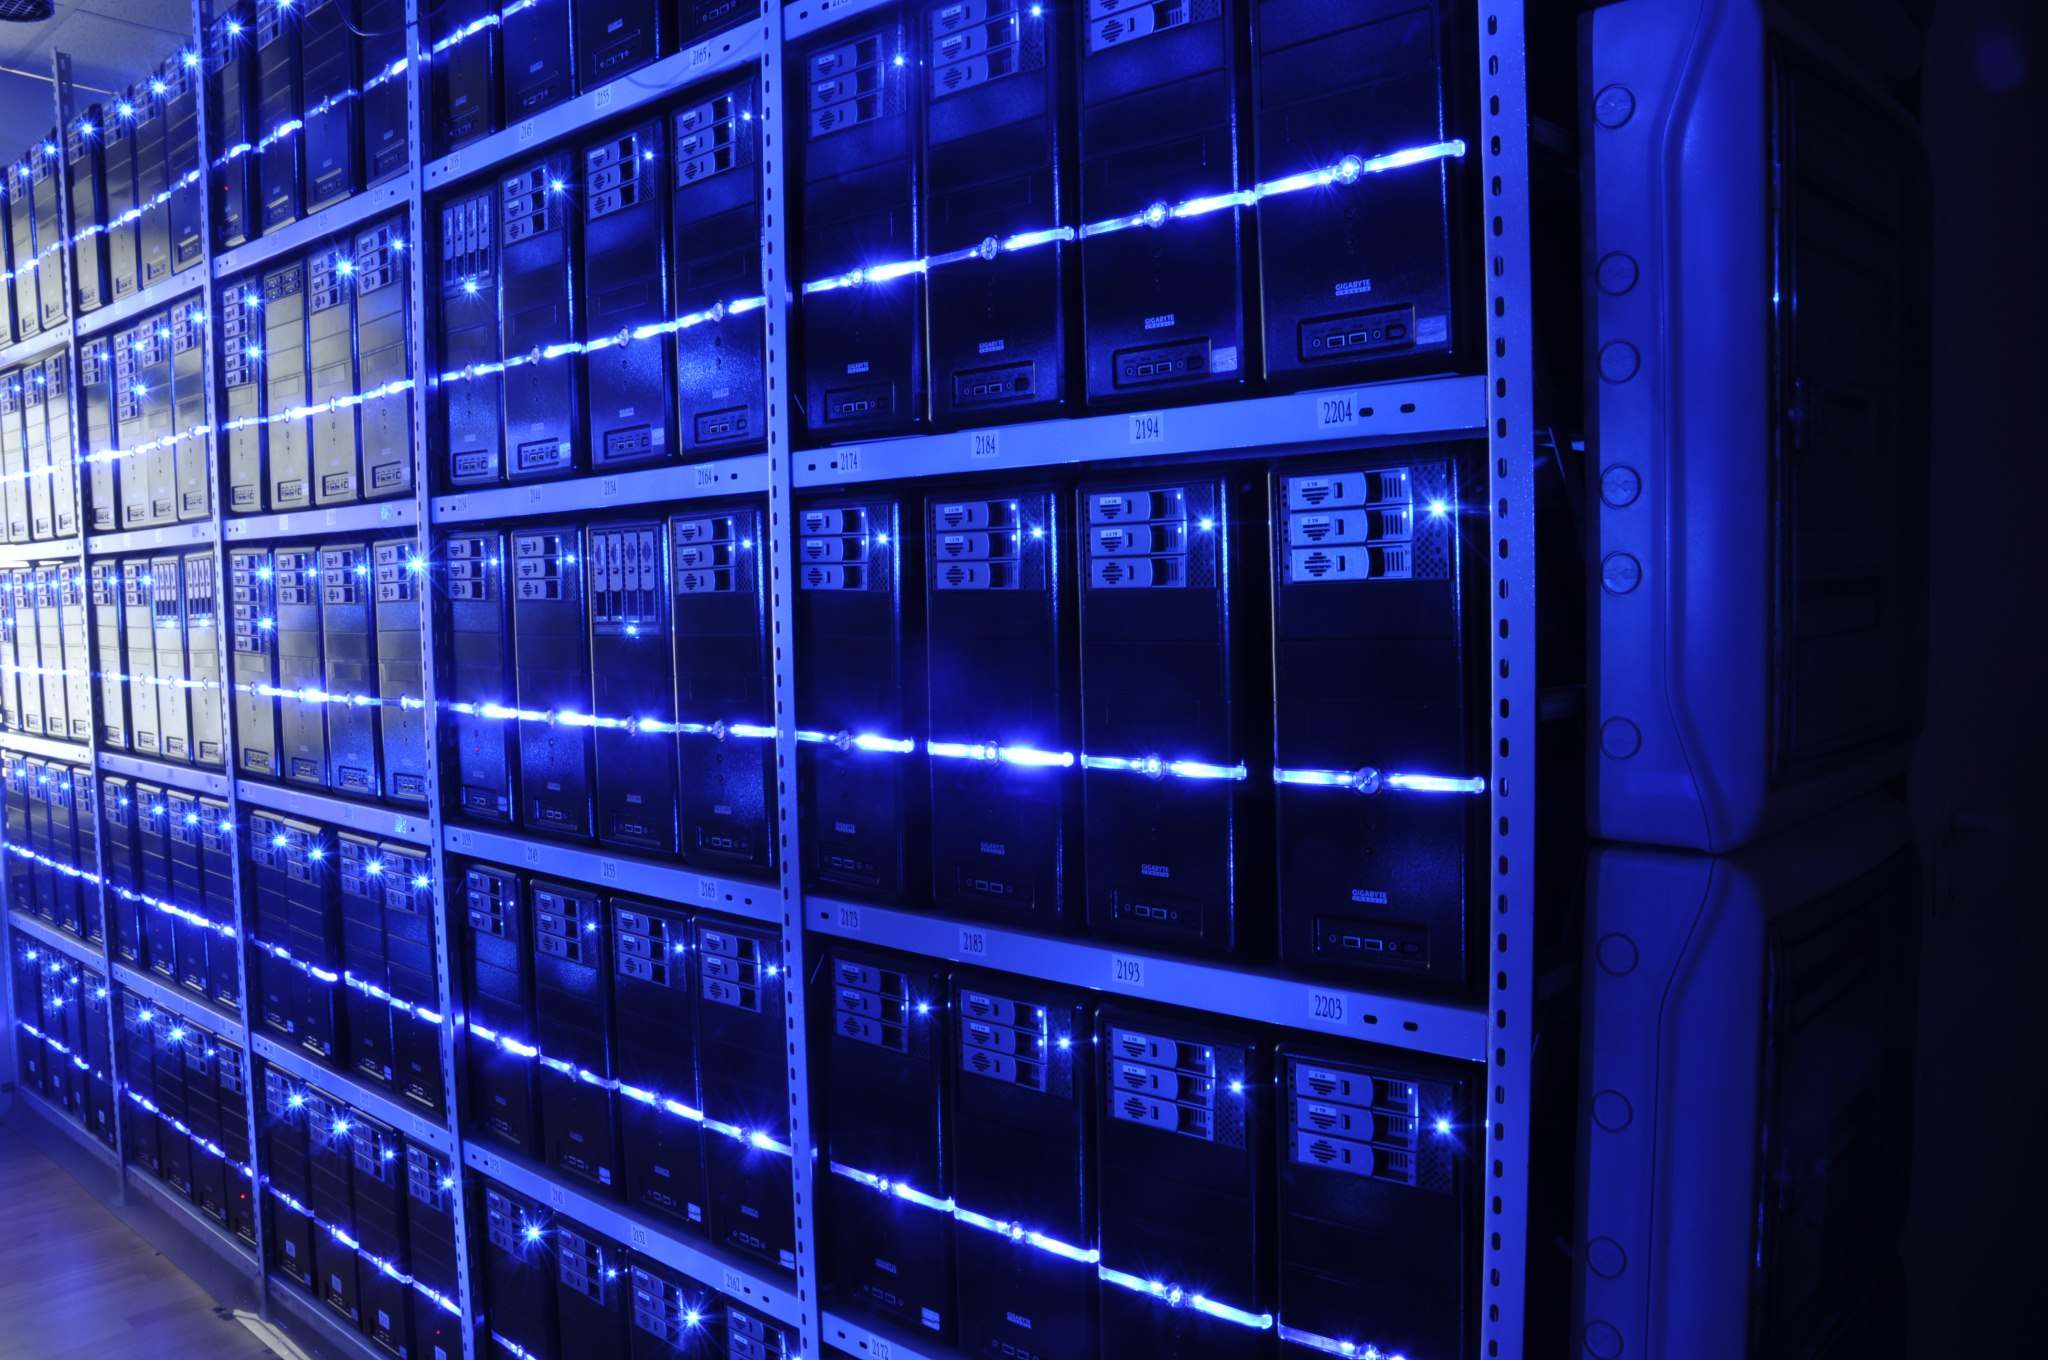
Performance work starts with measurements you can defend in a code review—not dashboard guesses. We scope each engagement after an inquiry so profiling depth matches your stack and release cadence.

We map hot paths with CPU samples, wall-clock spans, and allocator snapshots so you see whether the bottleneck is algorithmic, I/O-bound, or contention on shared resources.
Deliverables stay practical: flame graph walkthroughs, ranked change lists, and guardrail checks you can run in CI after patches land.
Review consulting focus areasYou share runtime, traffic shape, and the symptom—p99 latency, GC pauses, or runaway memory.
We attach profilers and tracers with production-safe sampling rates and reproducible load scripts.

We prioritize fixes by measured impact, note risks to correctness, and outline verification steps.
Your engineers keep the profiling recipes; we document baselines so regressions are obvious.
When access is granted, we prefer staging mirrors with anonymized data; otherwise we co-design replayable benchmarks.
Common JVM, Node, Go, and .NET stacks; we confirm tooling fit during intake rather than promising blanket coverage.
Each engagement is quoted after the inquiry once scope, on-call windows, and profiling depth are clear.